

SuiteScript Analysis in NetSuite APM
As part three of our NetSuite Application Performance Management series, this blog will delve into the SuiteScript Analysis module of APM. (You can read part one and two here: An Introduction to NetSuite APM, NetSuite App Performance Management: Page Time Summary)
The SuiteScript Analysis tool allows users to focus specifically on the analysis of scripts. Using this tool, you can extract script-related information such as when a script was installed and its performance for a specified time period (up to 30 days in the past). Users can also view execution times for locked or bundled scripts using this tool.
Accessing SuiteScript Analysis
To access SuiteScript Analysis details navigate to Customization > Performance > SuiteScript Analysis. You can also navigate to the SuiteScript analysis page from the Page Time Details page by clicking the name of the script in the Name column on the SuiteScript and Workflow Details section.
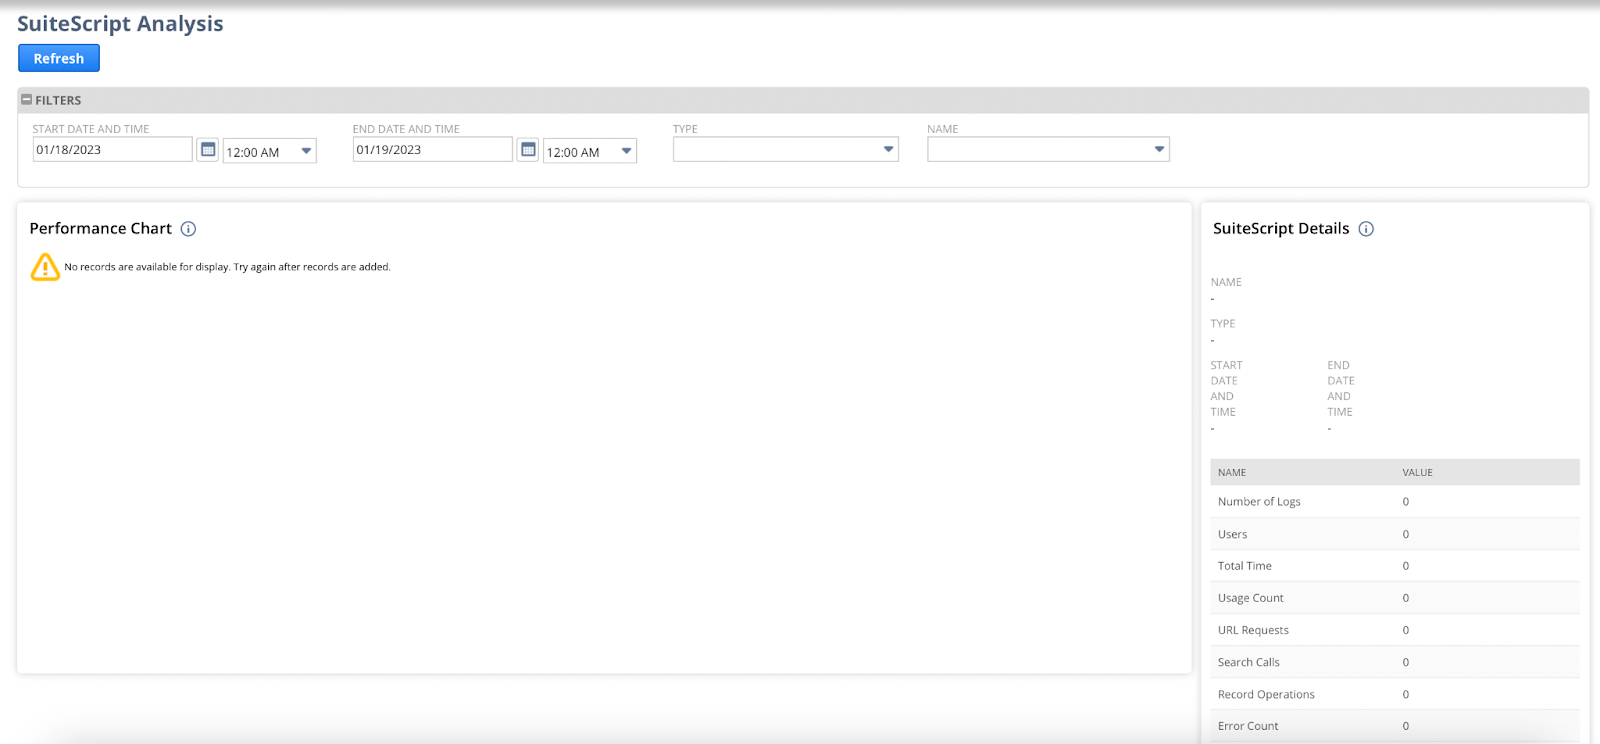
Once on the SuiteScript Analysis page, select a script type and script name and specify the time period. After selecting the criteria, click on the Refresh button to fetch the results for the entered criteria. The example screenshot below shows the following results when a Client script is selected for a 30-day time period. As can be seen in the example, an additional field Client Event Type is displayed when a client script type is selected with different script event types like “pageinit”, “saverecord”, “validateline” etc. Similarly fields like Map/Reduce Stage are displayed when Map/Reduce and Context User Event are selected in the type field.

The results have 2 main sections:
- Performance Chart – This displays an aggregate of SuiteScript execution over time. For more details about the average execution time, hover your cursor over a bar on the chart. Each bar in the performance chart represents a period of time. For example, in th image below, each bar displays data for an 8-hour time period. To drill down further, click on the bar to open another detailed chart for that selected period of time.

- SuiteScript Details – This section provides the details of the performance chart and includes the metrics such as the number of logs, URL Requests, and record operations for the selected time range. A sample is shown in the below image. This data is for a User Event script. Please note that data for some of these metrics are not available for client scripts. If a client script is selected, the value for usage count, URL requests, search calls, and record operations are denoted with a dash (–).
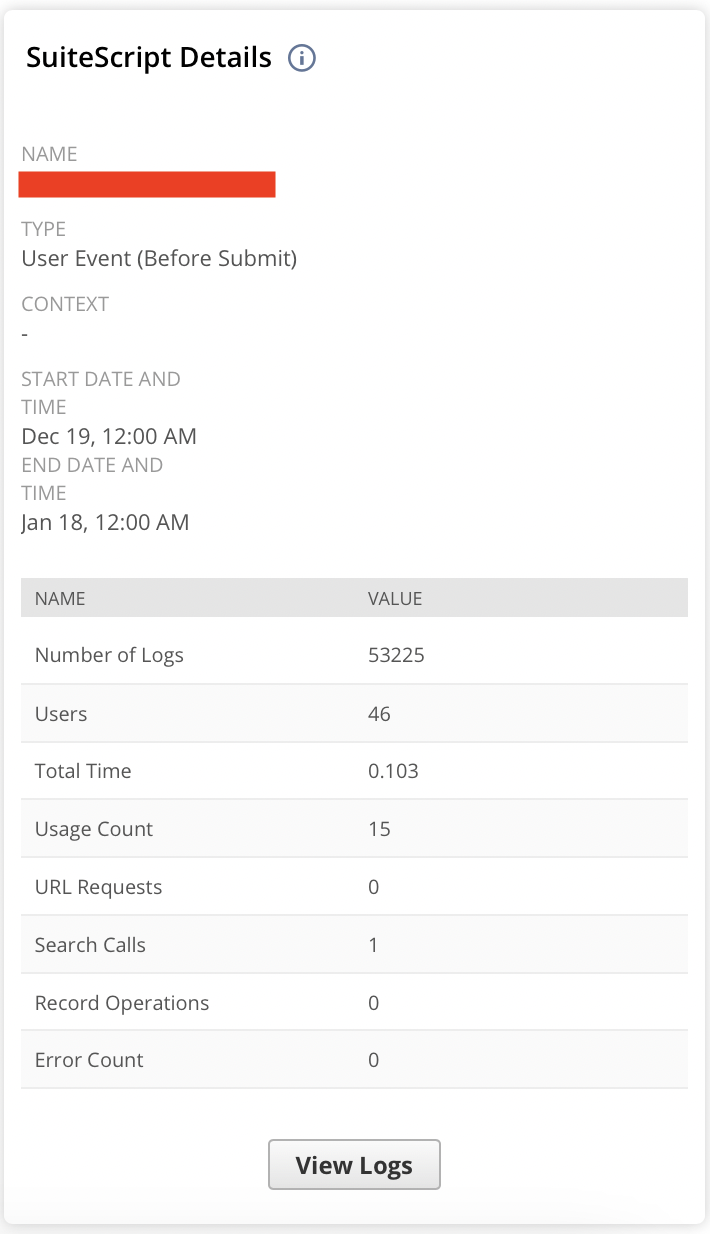
To view individual instances of script logs and related summary data on SuiteScript Details, click on the View Logs button.

The Details section of SuiteScript Analysis contains the following information:
- Date and Time – Shows the date and time when the script or plug–in instance ran
- Name – Shows the name of the user who ran the script or plug-in during the instance.
- Email Address – Shows the email address of the user who ran the script or plug-in during the instance.
- Role ID – Identifies the role that the user accessed to run the script or plug-in during the instance.
- Record ID – Identifies the record matching the script or plug-in that ran during the instance.
- Context – Shows the context for the script or plug-in that ran during the instance.
- Total Time – Shows the total number of seconds that the script or plug-in ran.
- Usage Count – Shows the number of governance units that were consumed during the instance.
- URL Requests – Shows the number of URL requests that ran during the instance.
- Search Calls – Shows the number of searches that ran during the instance.
- Record Operations – Shows the number of record operations that ran during the instance.
- Includes Errors – Shows if an error was encountered or not when the instance ran.
In addition to these columns, the Profiler Details for each instance can be seen. To navigate to the profiler pages, hover on an instance line in the details section and then click on the magnifying glass image under this column.
Profiler Details:
As discussed in our previous APM blog, Profiler Details is another tool that can be used to analyze the time breakdown of an operation to help locate and correct performance bottlenecks.

The Profiler Details page has 3 sections
- Overview – Provides high level overview of the operation instance along with the saved search, script and workflow counts
- Timeline – This section provides a graphical representation of the order of script execution and the duration of execution for each script
- Timing details – This is a tabular representation of the same data that is represented in the timeline section. Here you will be able to see the name of the script and deployment.