

NetSuite Application Performance Management: An Introduction
APM is a free bundle that you can install on your NetSuite account. It provides detailed performance information on your account’s customizations, saved searches and record/page load times. This tool is meant to help you identify poorly performing customizations or saved searches, fix them and help improve performance of your NetSuite account in general.
APM also allows you to drill down and fetch information related to specific record types or operations. You can also view the split of response times among client, server and network. Importantly, users can also export the performance data and logs and share them as needed to help troubleshoot any performance issues
Installing APM
Administrators can access and install APM. It is probably easier to use the Admin role to install APM. Administrators can then provide APM access to other roles and employees in the account. APM is available as a SuiteApp, which can be installed in your account by searching for the bundle name or id in “Search and Install Bundles” under Suite Bundler
- Bundle Name: Application Performance Management
- Bundle ID: 67350
After the installation, APM can be accessed by using the following navigation:
Customization → Performance
The specific components that are available for the users after installing APM bundle are as follows:
- Performance Dashboard
- Page Time Summary
- SuiteScript Analysis
- Script Queue Monitor
- Web Services Performance Monitor
- Concurrency Monitor
- Search Performance Analysis
We will look at each of these components in detail along with examples in the upcoming versions of this blog. For now let’s try to get a high level understanding of each of these above components offered by the APM bundle
Performance Dashboard
As the name suggests, this dashboard helps you monitor and identify any performance issues with your NetSuite account. It displays indicators for different record operations in NetSuite and allows you to configure record types and operations that you want to monitor. Clicking on the tiles in the dashboard lets you drill down further into these details. Take a look at a sample dashboard along with the expanded details of a tile:

Page Time Summary
This tool helps you to understand the page load times for different record types and corresponding operations. You can select any record type that you want to get the details for along with the operation and date/time range. This will display performance logs for the criteria entered, as can be seen in the below screenshot

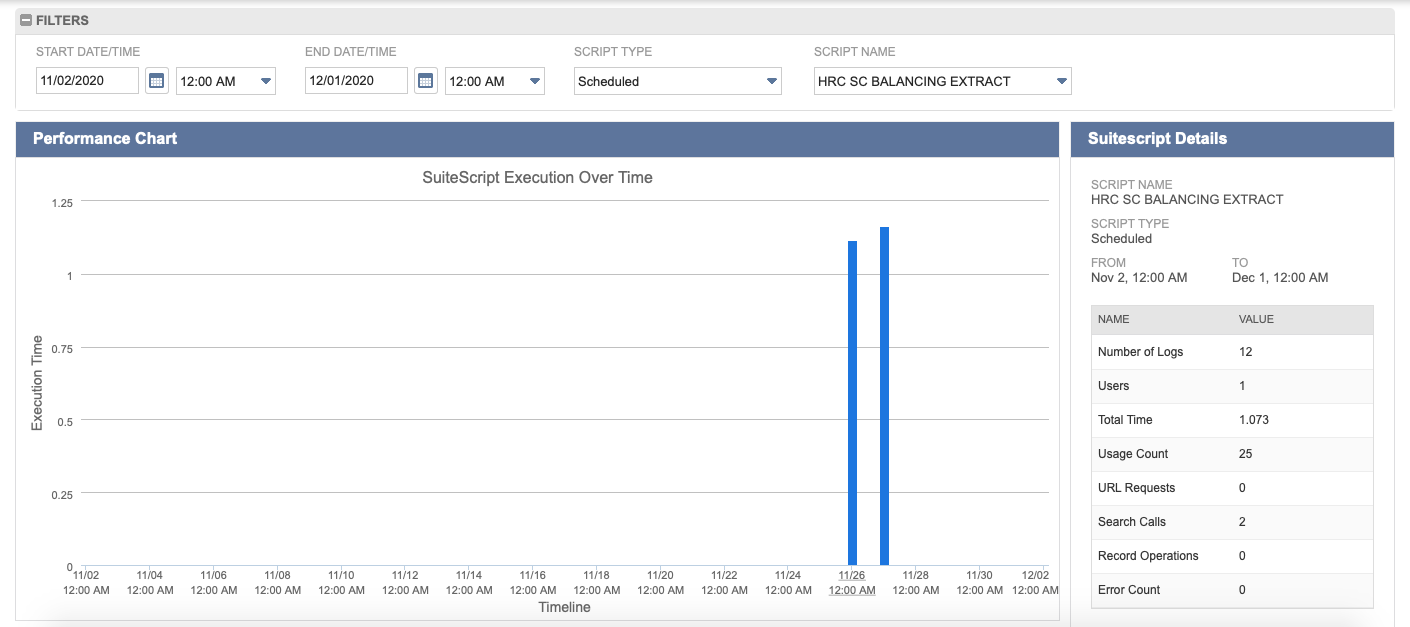
SuiteScript Analysis
You can use SuiteScript Analysis to learn about details of when a script was installed, and how it performed in the past. You can also view the timing of execution for locked scripts that were part of a bundle using this tool. Select a date range along with a script type and script name to pull analytics, as shown below:
Script Queue Monitor
This tool in APM helps NetSuite administrators get an understanding of their script queue usage. You may know that NetSuite provides us with the ability to assign specific queues for each schedule script deployment. This tool helps administrators view queue usage and optimize for better performance. The number of queues available for each account varies depending on the SuiteCloud Plus licenses available for that account.

Web Services Performance Monitor
Using Web Service Performance Monitor you can enter a date range, select a specific integration and retrieve the details of all the webservices for the entered criteria, including execution time, request count and error rate in your NetSuite account. This tool enables you to monitor the performance of your SOAP webservices in real time.

Concurrency Monitor
Within NetSuite, the number of connections you can have with the server one time is called concurrency. Each NetSuite account has a concurrency limit (based on the SuiteCloud Plus licenses of that account). NetSuite admins can go to Setup > Integration > Web Services Preferences and see their account’s Concurrency Governance called “ACCOUNT CONCURRENCY LIMIT”. The number listed there is the maximum number of concurrent requests that is allowed for a particular NetSuite account. This tool helps in monitoring and optimizing concurrency usage of your account
Search Performance Analysis
Using this tool, you can monitor the performance of saved searches in real time. Each saved search is displayed as a tile on the screen (similar to the tiles in Performance Dashboard) based on the date range. Clicking on a tile in a saved search allows you to drill down further to view search performance details